


E2134 Debrief
Today we look at SaaS valuation and two enterprise software companies: Snowflake & Palantir
Every week I’ll provide additional data to supplement our weekly Telltales podcast. You can get the podcast on Apple Podcasts, Spotify, or SoundCloud. Follow along with this newsletter to stay up to date!
In last week's debrief we dug deeper on two recent IPOs: AirBnB and Roblox. This week we continued our discussion on IPOs and covered two SaaS companies: Palantir and Snowflake. In this debrief, we will discuss SaaS valuations and share some data on Snowflake and Palantir.
SaaS Valuation
Growing SaaS companies (in both private and public markets) tend to be valued on a relative basis. We will cover a handful of valuation metrics that are used to value SaaS companies and use them to compare and contrast Snowflake and Palantir.
EV / NTM Revenue
Enterprise Value / Next Twelve Months Revenue shows how relatively cheap / expensive each stock is relative to their growth expectations
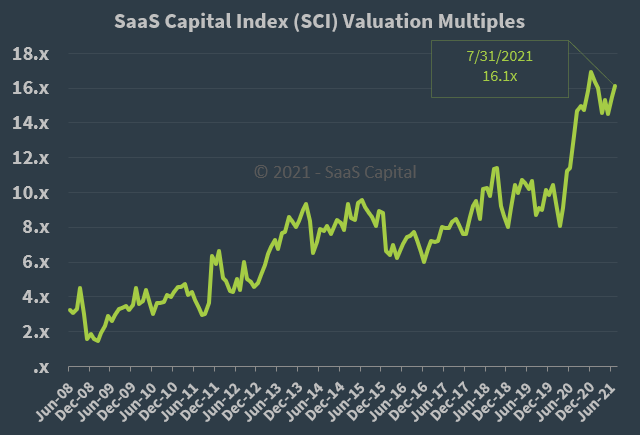
The following chart from SaaS Capital’s SaaS Index provides a historical context for SaaS valuations. Two perspectives could be gleaned from this chart…
SaaS valuations are high on a historical basis, and/or
SaaS valuations were too low in the past, and may still be too low
Note: the SaaS Index uses Market Cap rather than EV for the numerator in calculating multiples, this is not ideal but still provides good historical perspective.

NTM Revenue Growth Rate
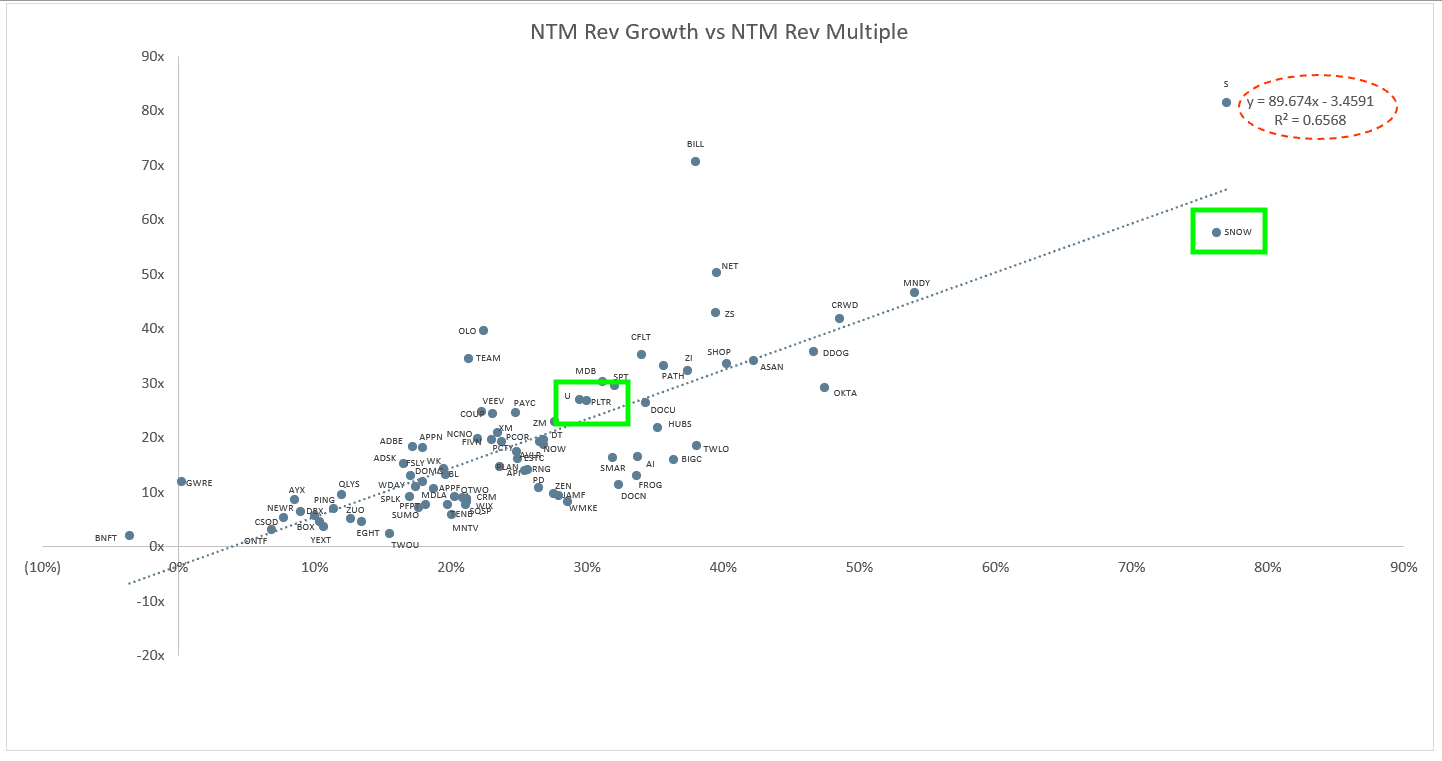
Next Twelve Months Revenue Growth Rate is the projected revenue growth rate for the next twelve months. From a regression perspective, this metric explains the most when it comes to SaaS valuations. The following chart from this week’s Clouded Judgement (which we will reference multiple times through this newsletter) shows the comps output from that simple linear regression. I’ve also highlighted Palantir (PLTR) and Snowflake (SNOW) in the chart below.
The basic interpretation of the chart is that if a company is above the line, it is expensive and if it is below the line, it is cheap. Note that the R value is .65, meaning there are certainly other factors at play.

You will notice that Snowflake is far out on the right of this graph, meaning, it has a very high revenue growth rate. The following chart compares Palantir and Snowflake’s quarterly revenue growth. As you can see in the chart below, Snowflake is outpacing Palantir.

Gross Margin %
The average and median SaaS gross margins are 73 and 76%, respectively1. When comparing Palntir and Snowflake, we see that Snowflake’s gross margin’s are much lower than Palantir and other companies. The reason for this is that Snowflake requires more compute and data storage than typical SaaS products. One way to think about this is that a higher percentage of the total value of Snowflake’s product is derived from the actual computation and data storage, which are essentially commodity priced. As a result, this is a large part of Snowflake’s COGS (cost of goods sold), and therefore results in a lower gross margin. Palantir, on the other hand, sells both cloud based and on premises solutions as well as consulting services. This mix is higher margin than that of Snowflake. Importantly, Gross Margin % drives gross profit, which, in a SaaS company ought to grow faster than operating expenses.

Other Operating Metrics
There are many operating metrics beyond revenue growth that public and private investors use to value SaaS companies. Here we will cover Gross Margin adjusted Payback and Net Retention. At the bottom of the post I’ve included a comp table, with Palantir and Snowflake highlighted, that you can use for comparisons.
Gross Margin adjusted Payback shows the number of months it takes for a SaaS business to payback their fully burdened CAC (customer acquisition costs, i.e. Sales and Marketing Expense) on a gross profit basis. In the case of Snowflake, we see that it takes about 20 months for Snowflake to pay back it’s Sales & Marketing investment to acquire new customers. When compared to its peers, this is very good, especially considering the company’s high rate of growth. Palantir is shown as ‘n/a’ because it does not disclose how much of its revenue is actual recurring revenue. It is generally understood that a high percentage of Palantir’s revenue is from consulting and other services2.
Net Retention takes into account total revenue minus any revenue churn (caused by departing customers, or customers who have downgraded) plus any revenue expansion from upgrades, cross-sells or upsells.
Note: not all companies report net retention, and the ones that do, don’t always calculate it the same way. Check the notes to the financial statements for each company for more details.
Net Retention north of 130% is excellent. At 169%, Snowflake is exceptional. This is, at least partly a function of the company’s business model. They bill based on consumption rather than on number of users. Consumption based models are powerful because they grow with the business. For Snowflake, simplistically, as data increases so does billing. For investors, this brings comfort as data volumes are expected to continue to grow exponentially. Palantir, again, is listed as “n/a” because it does not report net retention.

Comp Table

If you are interested in learning more about SaaS valuations, I recommend checking out Jamin Ball’s Clouded Judgement newsletter (link below) which provides weekly relative valuations of publicly traded SaaS businesses.
Until next week, stay healthy and stay informed!
This archive of a now removed HBS article provides good insight to Palantir’s software/services mix